Nelson's Column
Charlie Nelson's Blog
Australia's Climate
Commission wrong on southeastern Australia's rainfall trends
Australia's climate scientists must be wilting under all the criticism that has been heaped on them over their inability to predict the breaking of the long drought in southeastern Australia.
As an example, in May 2010, the CSIRO published a report that concluded "However, overall, due to the influence of global warming, it would be expected that future conditions will be drier and warmer than the long-term historical climate in south-eastern Australia". Inconveniently, 2010 ended up being the wettest year on record in the Murray Darling Basin.
Perhaps because I told the Murray Darling Basin Authority in September 2009 and again in March 2010 that the breaking of the drought was imminent due to the ending of natural cycles, the report also says "...it could be argued that a return to wetter conditions is likely in the near future, and that any association of the current dry period with global warming is simply fortuitous. This is considered to be unlikely by SEACI researchers". The report, "Climate variability and change in south-eastern Australia" cost some $7.5 million and was worked on by 31 scientists from CSIRO, 13 from the Bureau of Meteorology and had science panel and steering committee with a total of 12 people from a variety of organisations.
After over two years of good rainfall, in fact too much for many, the Climate Commission has put out a report in mid-March 2012 to try to convince the public that the science is still correct ("The science behind southeast Australia's wet, cool summer" available at www.climatecommission.gov.au). It was authored by Professors Will Steffen, Matthew England, and David Karoly. In my view, it is misleading, unscientific, and plain wrong. I set out my reasons in a letter to Professor Will Steffen, reproduced below.
19 March 2012
Professor Will Steffen
Climate Commissioner
Climate Commission
GPO Box 854
Canberra ACT 2601
Dear Professor Steffen
The science behind southeast Australia’s wet, cool summer
I am writing to point out the weaknesses in the case you present to justify your conclusion that the long-term trend in southeast Australia has been declining rainfall.
I should point out that I am no global warming sceptic. I have no doubt about the theoretical underpinnings of the science of increased concentrations of greenhouse gasses leading to warmer temperatures and I have confirmed the empirical evidence with my own analysis.
However, your contention that rainfall in southeastern Australia has a long-term downward trend is not proven by the information in your report. The potential consequences of this are discussed at the end of this letter but first I put forward evidence that your conclusion is misleading. I will address two charts used in your report – Figure 2 (trends in annual Australian rainfall) and Figure 5 (cumulative rainfall variations in southeastern Australia).
Trends in Australian rainfall
I have replicated your Figure 2 below in Chart 1. The first deficiency in this analysis is that there is no indication of the degree of statistical significance of these trends. I have checked some of them and they are not all statistically significant and so should not be used as evidence of long-term trends.
For example, I have analysed the BOM data for southeastern Australia. The table below shows the trend for several periods and the p-value for the trend being less than zero. The trend is not statistically significant for any of these periods and so does not support your conclusion.
|
Period |
Trend (mm per year) |
P-value |
|
1970 to 2011 |
-2.2 |
0.15 |
|
1960 to 2011 |
-1.1 |
0.29 |
|
1900 to 2011 |
-0.8 |
0.80 |
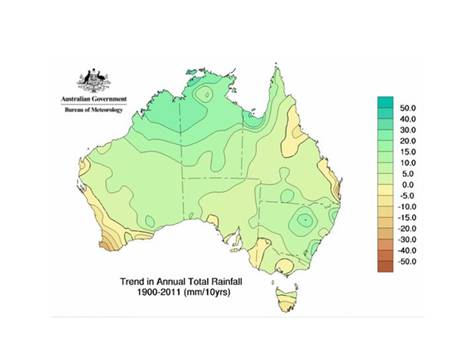
The second problem is that these trends are not robust. In Chart 2, I show the same analysis but with the starting date of 1960. It is a very different and less alarming picture. In Chart 3, I show the same analysis with 1900 as the base year. Apart from southwestern Australia the long-term trends are not steep and many, if not most, would not be statistically significant. In other words, the long-term trend is not robust. Given that global warming has been occurring since 1900 the lack of significant rainfall trends since then is contrary to your claims. You leave yourself open to the accusation that you chose a base year to suit your argument and in any case the trends are mostly not significant.
Chart 1
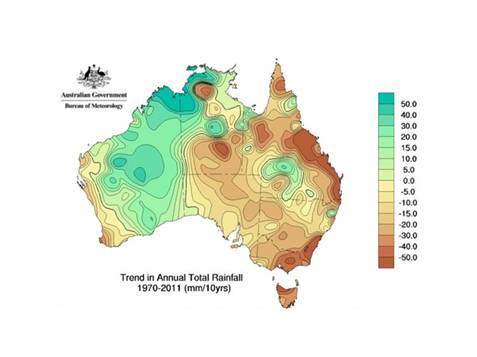
Chart 2
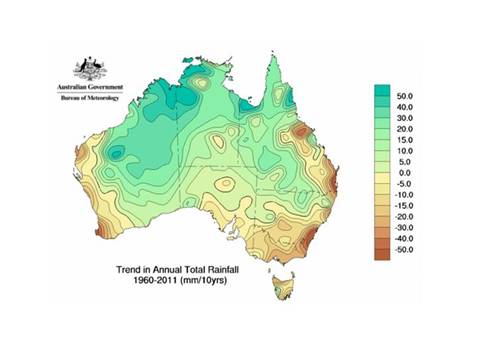
Chart 3
Cumulative rainfall variations in southeastern Australia
Your Figure 5 is also potentially misleading. I have reproduced your Figure 5 (Chart 4) using annual data to remove some of the clutter associated with monthly data.
It is important to note that your original chart does not allow for the impact of at least three important explanatory factors.
- The Indian Ocean Dipole (IOD). This is a major influence on rainfall in southeastern Australia as established by Ummenhofer et al. (“What causes southeast Australia’s worst droughts?” Geophysical Research Letters, Vol 36, 2009). The IOD was not in a state which favoured rain between 1997 and 2009. But there was a favourable IOD in 2010 which is partly responsible for the recovery in rainfall in 2010. Your report does not appear to mention the IOD.
- The 18.6 year lunar node cycle. I have identified this as an important (and predictable) driver of rainfall in southeastern Australia.
- The factor which caused the drought to temporarily intensify over the period 2006 to 2009. I have identified this factor X and it is a rare natural factor.
Compare Chart 4 with Chart 5, which runs from 1986 instead of from 1997. The lunar node cycle switched to its dry phase in 1997 while the period 1986 to 2005 includes both wet and dry phases. There is a much smaller cumulative deviation over the 19 year period to 2005 (170mm) than your analysis from 1997 (464 mm), illustrating the importance of the lunar node cycle. Apart from the 2006 to 2009 period, which I have been able to explain and which is now being reversed, there is no evidence of a large long-term downwards trend. Your choice of the base year for your analysis is clearly misleading, as is the exclusion of explanatory factors from the analysis.
Chart 4
Chart 5
There is certainly a significant correlation between the sub-tropical ridge (STR) pressure and rainfall in southeastern Australia. But the STR pressure has not increased since the early 1990’s and may indeed be falling. This is clearly not the factor which caused the drought from 1997 to 2009. It contributed to the starting of the drought and the dry 2006.
Your colleague Professor David Karoly kindly looked at my analysis of the impact of the lunar node cycle in mid-2009 and rejected it.
I attach for your information a page from my testimony on 29 June 2009 to the inquiry into long-term meteorological forecasting by the House of Representatives standing committee on industry, science, and innovation. The full transcript can be downloaded from http://www.aph.gov.au/hansard/reps/commttee/r12143.pdf. You can also download my final submission to the inquiry at http://www.aph.gov.au/house/committee/isi/weather/subs/sub23-1.pdf.
As you can see, Fran Bailey grilled me about Eildon. She asked if my research was in agreement with CSIRO’s prediction, for example, that Lake Eildon will never reach more than 30 per cent of its capacity over the next 30 to 40 years. I answered in the negative. When she asked me “Are you saying that you believe from your research that Lake Eildon could fill in the next few years?” – I said “It could”. And it seems I was right! Eildon was full again by October 2011.
Since my submission to the parliamentary inquiry, I have identified the reason for the worsening of the drought over the period 2006 to 2009 and our subsequent relief. In September 2009 I contacted Melbourne Water, the Murray Darling Basin Authority, the Department of Sustainability and Environment, and Professor Karoly about the imminent ending of the long drought. Perhaps understandably, given that my predictions were contrary to those of the CSIRO and Bureau of Meteorology, they showed no interest.
Potential consequences incorrectly attributing the drought to global warming
There are many important consequences if the 1997 to 2009 drought in southeastern Australia is attributed primarily to global warming when in fact other drivers are more influential.
- Suboptimal infrastructure investment has already occurred and may continue when the next drought inevitably arrives. In Victoria there has been the controversial north-south pipeline (now in mothballs) and the even more controversial huge desalination plant (which will not be needed until 2020 at the earliest and possibly until 2040).
- Insurance companies may mis-price the risk of flooding events.
- Farmers may be unnecessarily convinced to abandon farming.
- The reputation of climate scientists may be eroded. This, in turn, could lead to complacency about preparing for the next drought which is of course inevitable and is likely over the period 2015 to 2022.
Conclusion
It is important and urgent that the correct attribution of the driving forces of the recent long drought in southeastern Australia be established.
I would like to help with this. You may say, as others have, “we will consider your views when you have published a peer reviewed paper which establishes a plausible mechanism”.
I am working to this end but it will take a long time because I am a business consultant not an academic. I do not have good access to the literature, data, and ideas.
Time is a luxury we cannot afford if we are to convincingly communicate to the public, and their representatives in parliament, the need for urgent action to reduce greenhouse gasses.
I would be happy to present my analysis to you and your colleagues.
Regards
Charlie Nelson
Managing Director